Introduction to Machine Learning with R
Machine learning is a powerful set of techniques which can help in the understanding of complex datasets. At the same time, these techniques can produce confusing or misleading results if used without care.
In this course we cover the concepts of machine learning and we look at some of the most common types of model. We go through the best practices for implementation of data preparation and modelling, and we show how to practically build your own models in R using the tidymodels package.
Introduction to Python
![]()
Python is one of the most common general purpose languages used in bioinformatics. In this course we provide a complete introduction to the core python language with the intent of allowing you to develop small python applications. We cover all of the main concepts in the core language as well as the standard library.
By the end of this course you should be able to develop your own python applications to help with automating or processing data.
Note that this course is not based around the use of python for data analysis - this type of use is focussed on a particular subset of packages and is not covered in this particular course.
Introduction to R

R is a specialised programming language whose main purpose is the maniupulation, visualisation and analysis of datasets. It is one of the core tools used in many numerical disciplines and is very popular in the field of bioinformatics.
This course provides a ground-up introduction to the core R language, and uses the modern tidyverse framework to show how to easily import, transform and plot datasets.
This course is an invaluable foundation for anyone wanting to use R in their work.
Introduction to Statistics with GraphPad Prism
![]()
GraphPad Prism is a user-friendly commercial desktop application commonly used for the analysis of biological datasets.
This course provides an introduction to the functionality of the program for analysing data, coupled to an introduction of the statistical concepts which allow for effective and robust data analysis.
Processing and Analysing RNA-Seq Data

RNA-Seq is a very common high throughput sequencing technique used to measure the transcriptome of a biological sample. This course goes through the whole process of RNA-Seq data processing, visualisation and analysis, from raw fastq data to a validated and annotated set of hits.
We look at the way RNA-Seq libraries are constructed and the effect this has on downstream steps in the analysis. For each part of the pipeline we look at what can go wrong, how to assess that things are working, and remedial steps you can take to correct or explore problems.
After this course you should have the confidence to be able to process and analyse your own data for a simple RNA-Seq experimental design.
Scientific Figure Design
Figures and graphs are the way we communicate our science to others. Producing attractive figures which are easy to interpret is the best way to make a convincing case for a scientific story you are trying to tell.
In this course we look at a number of ways to help you produce better figures. We examine the underlying theory of why humans find some figures easier to interpret than others, we extend this to look at our options when using common plot types, and then we bring in relevant aspects of graphical design to make the appearance of figures as appealing as possible.
Finally we look at the use of the open source Inkscape program to allow the customisation of existing graphs, and assembling multiple figures into panels.
Advanced R
This course follows on from the introductory course in familiarising you with the core R language
In this course we focus on extending your language knowledge to include more advanced filtering and data maniupulation. We look at data restructuring if your original data isn't in the right format, and the summarisation of datasets with repeated values. We also show how to deal with awkward data - files that don't import cleanly, have missing values or are inconsistently annotated. This course will make you a more practial and proficient R programmer.
An introduction to Proteomics

High throughput proteomics is becoming increasing popular as a technique to profile the proteome of biological samples.
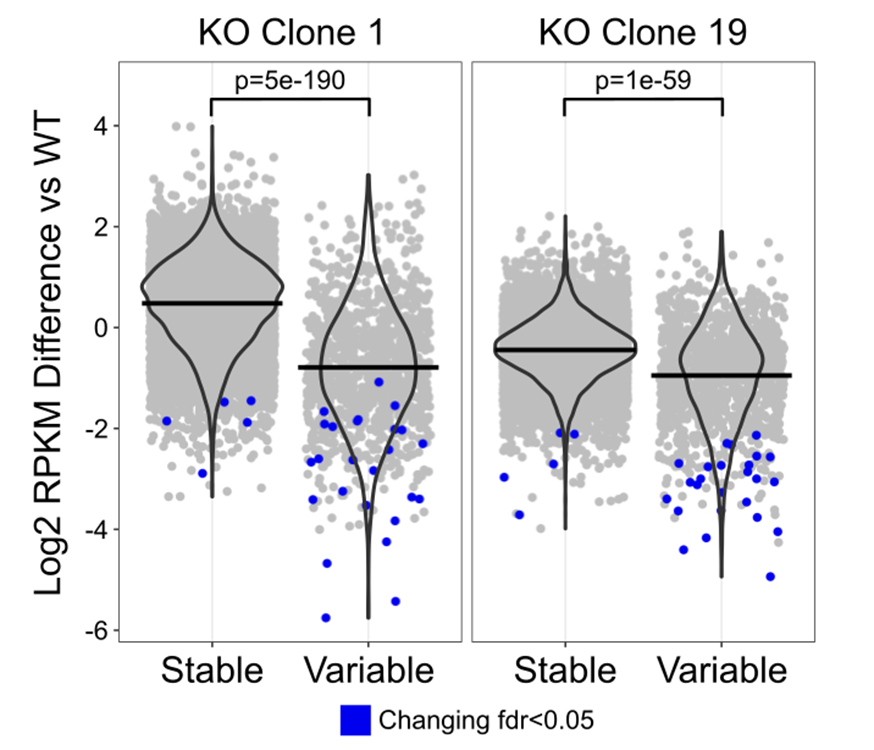
This course looks at the theory of proteomics, the processing of raw mass spectra into quantitative values, and some options for the analysis of quantitative proteomics data to identify differentially abundant proteins.
Analysing Single Cell RNA-Seq Data
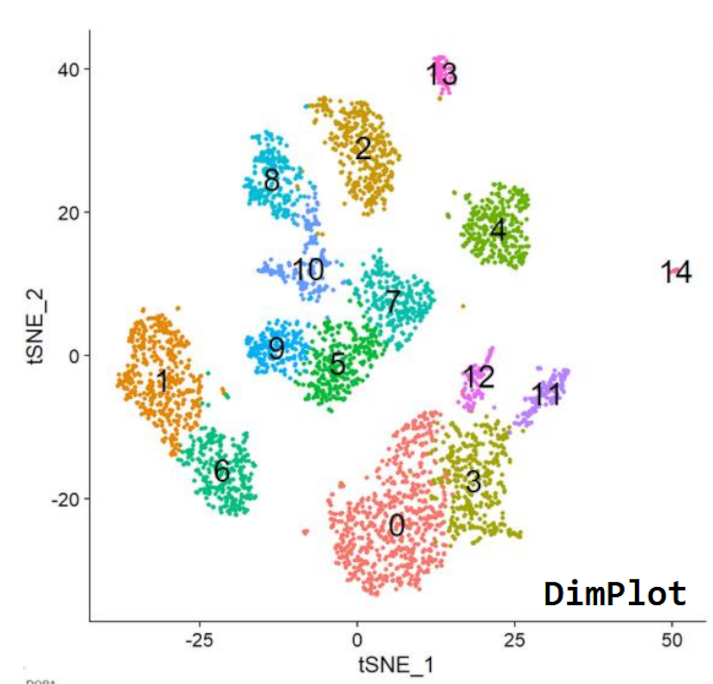
The ability to look at samples at the level of single cells has transformed the way we can look at complex samples. 10X is the most frequently used platform for the creation of high throughput single cell RNA-Seq data. In this course we look at the processing, exploration and analysis of this data using both desktop tools such as the Loupe Browser, and R packages such as Seurat. As well as standard analyses we also look at the types of artefacts and problems which affect this data and how to identify and remedy them.
Creating Complex Figures with GGPlot
In R ggplot is the tidyverse package for drawing figures and graphs. This course follows on from the introductory and advanced R courses and looks in much more detail at how to construct and customise graphs using ggplot. By the end of the course you will be able to produce and save complex, multi-layered plots with custom annotation and colouring.
Documenting R Analyses with Quarto
Quarto is an environment which allows you to create documents containing R code, R output and formatted text. It allows you to write professional looking reports of your R analysis and compile these into HTML or PDF documents. These are the ideal way to share your analysis with others.
Here we go through how to create, edit and publish Quarto documents from within R studio to make your life easier when writing and communicating your R work.
Extracting Biological Information from Gene Lists

The end point of many different high throughput experiments is a list of interesting genes, often accompanied by metrics such as p-values or fold changes. Making biological sense of these lists can be challenging but is crucial if we are to target the most relevant aspects of biology.
In this course we look at the data sources and analysis techniques which allow us to find the interesting biology behind a set of genes. We look at functional gene set enrichment analysis from both lists of gene names and quantitative data. We consider the choices we get in these techniques, the artefacts and biases which can mislead us, and the options for how to present the results we get.
We run the analyses initially in a web browser, but then also show how to do this in R
Introduction to Linux and Bash

The processing of many modern datasets requires the use of a unix or linux environment, and many people use this as their preferred operating system. In this course we look at how you can use the unix command line to control the running of individual programs, to manage your data and to perform some basic automation to make large scale processing easier.
Introduction to Statistics with R

The R language is an environment designed for statistical analysis. This course follows on from our introductory R courses to look in much more detail at the statistical aspects of R. It provides both an introduction to core statistical concepts and common tests, as well as how to practically implement and visualise these in R.
The course goes through all common aspects of statistics, from power analysis and experimental design to summary statistics and the analysis of both quantitative and qualitative data.
After attending this course you should have the theoretical knowledge of how to select and correctly apply a statistical test, and the R skills to put this into practice.
NGS Sequencing Quality Control

In NGS sequencing you want to be able to identify problems in your data as early as possible to save wasted effort and to allow you to apply corrections. This course looks at the ways you can assess the quality of NGS data, the different types of failure you can have, and the options for ways to correct any issues you identify. It covers both the theory of how Illumina sequencing works, and the practical early stage analysis of this data.
Package Development in R
An R package is one of the simplest ways to write reusable code which can be used across projects or shared with others. This course shows you how to take functions you have developed and put them into the framework of an R package.
It further shows how to write more robust functions including dependencies, error handling and the use of test suites to ensure code integrity.
By the end of the course you should be able to write and distribute your own packages
Processing and Analysing ChIP-Seq Data

ChIP-Seq is a high throughput sequencing technology which allows you to identify the position on the genome of anything you can target with an antibody. It was originally used to find trancsription factor binding sites, but has now been extended to many other epigenetic and regulatory marks. There are also other related techniques such as ATAC-Seq or Cut-n-Run etc. which adopt the same analysis proceedures as more traditional ChIP.
In this course we look at the processing and analysis of this data, looking carefully at how to evaluate data quality and identify artefacts which might confound your analysis. We go through options for visualisation and exploration of the data as well as more formal analyses such as peak calling and differential enrichment.
Research Integrity (How to be a good scientist!)
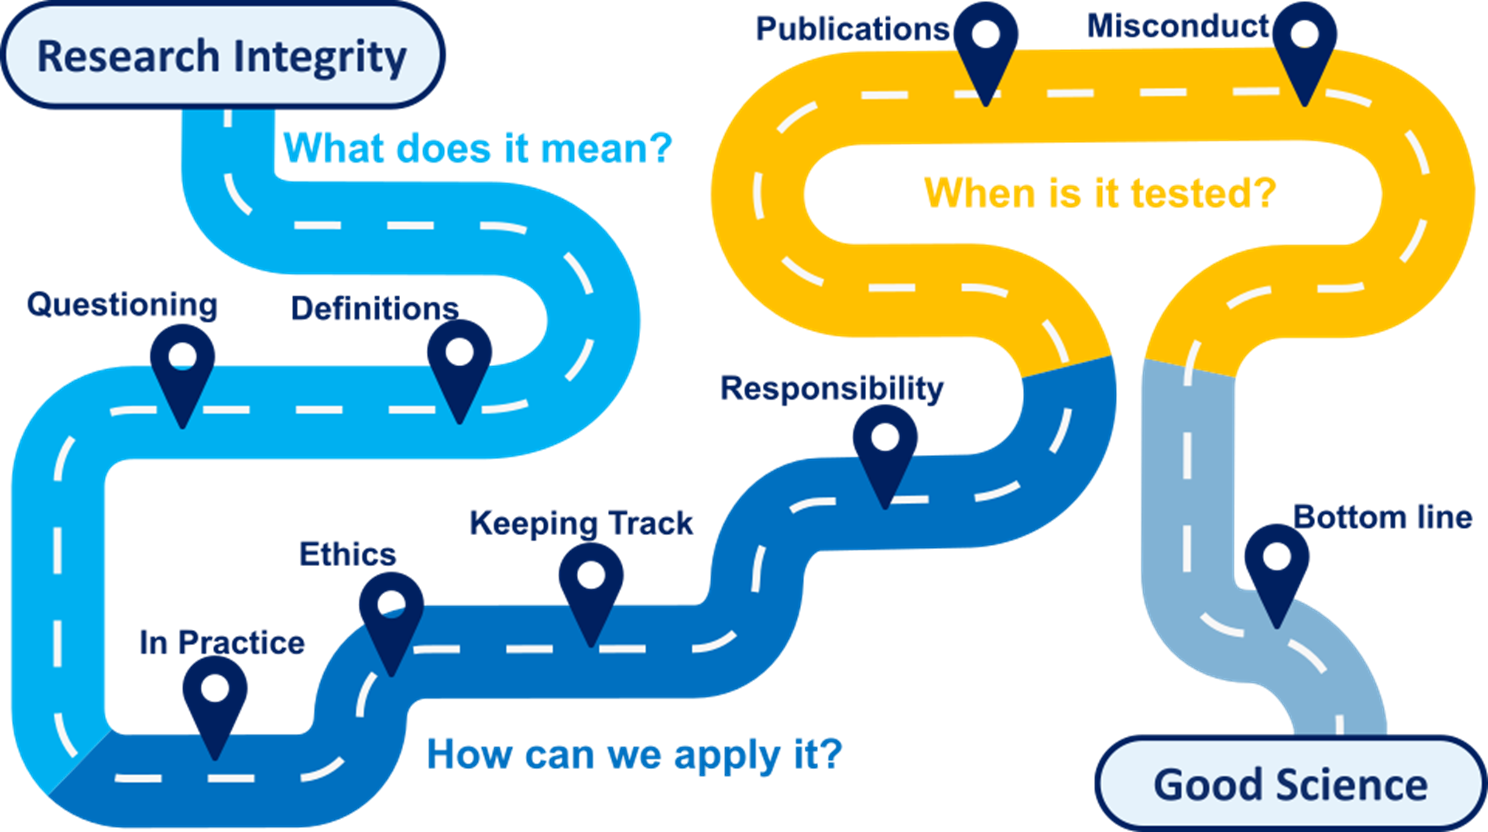
Making Good science depends on a number of key factors including a robust approach to experimental design, objective data analysis and effective collaboration with others.
This highly interactive course is practical, discusive and throught-provoking - helping to guide best practices for scientific investigations and aids in fostering collaborative and productive working relationships between scientists.
The course provides a biology specific context for research integrity and is designed to go far beyond more generic box-ticking training in this area.
Writing interactive R web applications with Shiny
Shiny is an R framework which allows you to create interactive web applications based on R code. This course goes through the basic principles of Shiny and shows how you can use these to build and host your own interactive application.